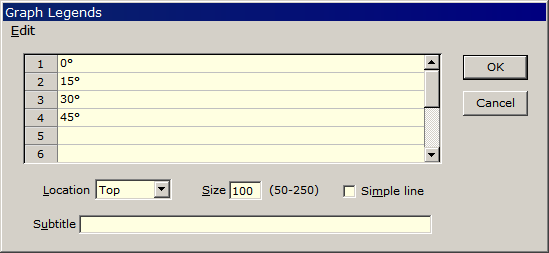
Technical Issues - FSPlot Tutorial II - LegendsLegends are labels assigned to multiple FSPlot curves. While legends are usually entered manually it is also possible to assign/modify text in FilmStar BASIC. In that way one could, for example, assign legends such as average %R computed from the spectral curve. Activate the FSPlot Module and click Setup.. Legends <Ctrl+E> to access the Graph Legends dialog. Up to 12 legends can be entered.
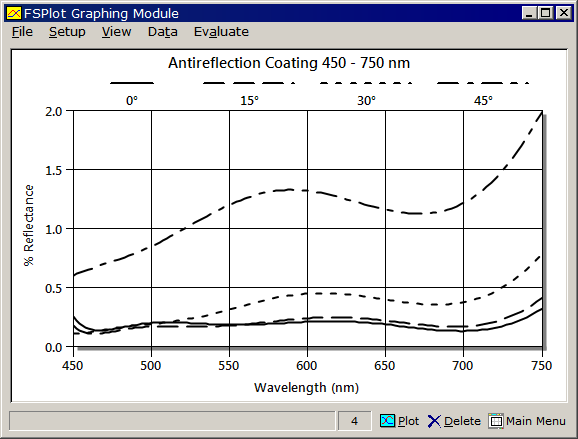
Legends are displayed as curves are added to the graph. Top and Bottom legends are displayed when there are two or more curves.
Don't see any legends? View..
Legends must also be checked. This option lets you hide legends temporarily
without deleting them from the Graph Legends dialog. Legends are saved in DESIGN
Graph Axes (*.axw) or FILM Archive (*.faw) files and in MEASURE (Scantraq) Scan
Method files (*.scw). While legends are usually placed on top of the graph, it
is sometimes advantageous to place them on the left or right.
No legends? View.. Legends
must also be checked. This option lets you hide legends temporarily without
deleting them from the Graph Legends dialog. Legends are saved in DESIGN Graph
Axes (*.axw) or FILM Archive (*.faw) files and MEASURE (Scantraq) Scan Method
files (*.scw). While legends are usually placed at the top, it may be
advantageous to place them at the left or right.
Click here
to download an Excel file with advanced legend options including %R & %T
(or OD & %T) on the same graph.
|
Copyright © 2023 FTG Software Associates
Last updated on
January 31, 2023