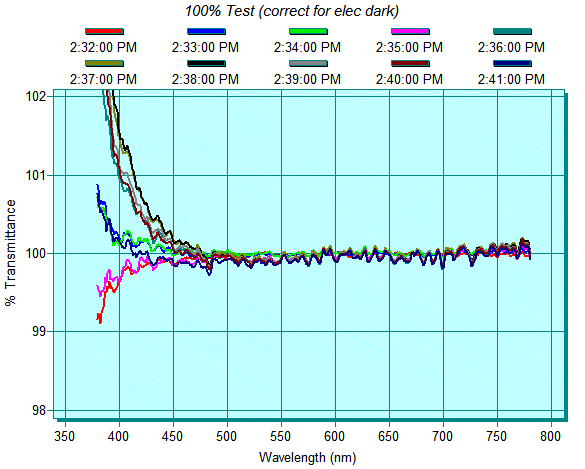
Technical Issues - Color Measurements with Diode-Array SpectrometersIs a single-beam diode-array rapid-scan spectrometer useful for CIE color filter measurements (380-780 nm)? Is a deuterium (D2) UV lamp required? To examine these issues we measured two Hesaglas (Notz Plastics AG) with an Ocean Optics USB2000 with tungsten halogen (W) lamp. Measurement details: 12 ms integration, 500 repeats, 5 pixel boxcar, FilmStar MEASURE software with Ocean Optics Server. A possible problem is instability < 500 nm. As can be seen in three superimposed FSPlot graphs of ten 100% scans repeated at one minute intervals, variations are essentially random. Each group of ten scans followed a dark scan (beam blocked) and a reference scan.
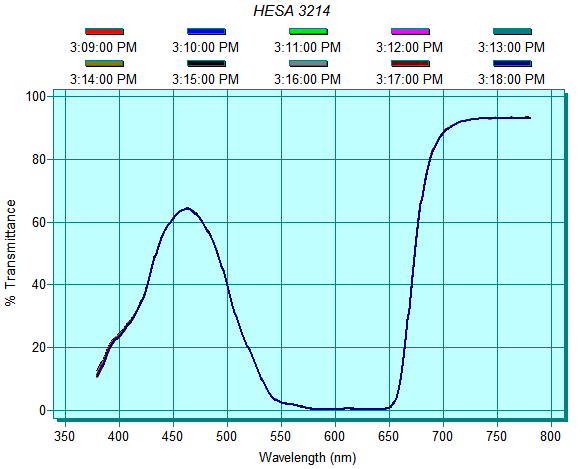
Our perception of the instability issue changes when we switch to a 0-100% scale. The spectrum of a HESA 3214 dark blue filter appears only slight affected.
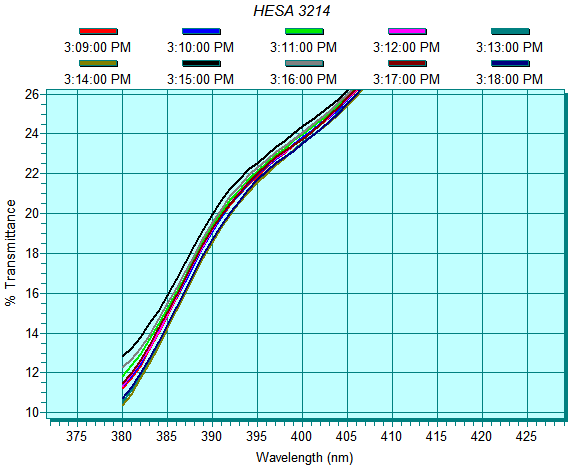
Zooming gives a clearer picture.
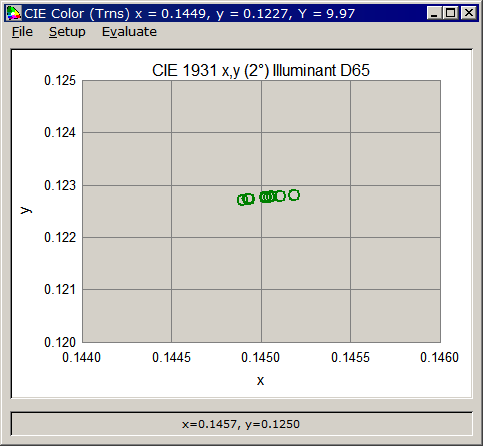
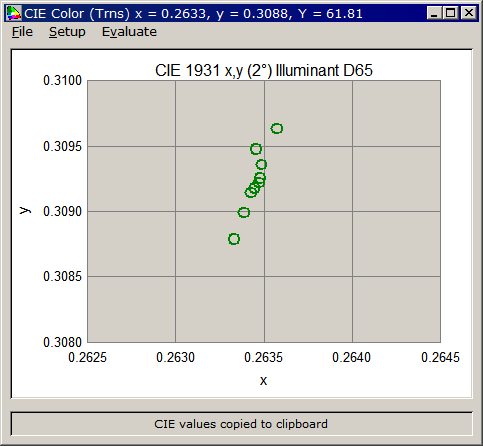
Next we view these variations as color coordinates. Here ± CIE x,y tolerances (based on perceived color differences) far exceed this variation. But that is something that must be determined for different filter types. The ability to plot multiple coordinates was added in MEASURE 2.51.0108. Check Plot multiple points in the CIE Setup Parameters dialog to enable this feature. Activating the CIE window automatically adds new CIE coordinate pairs.
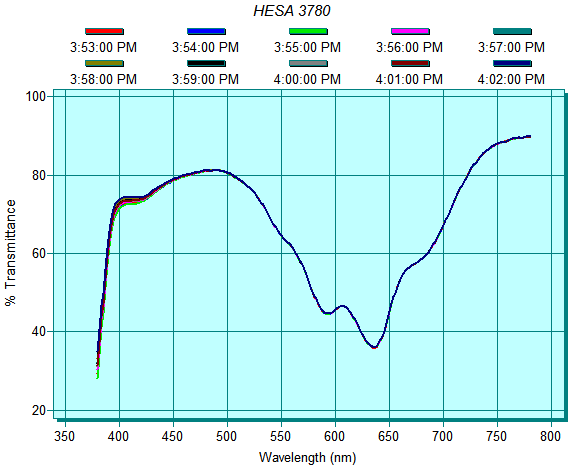
HESA 3214 has only 24% transmittance at 400 nm. Consider next a HESA 3780 light blue filter with ~ 73% transmittance at 400 nm.
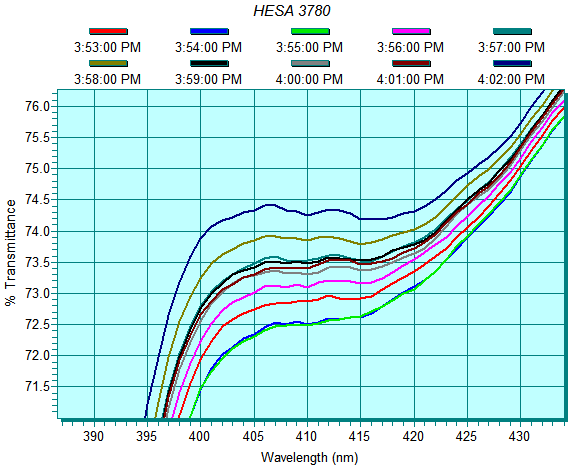
As can be seen in the zoomed graph, variations are more pronounced.
Viewing variations on a color chart, ± CIE x,y tolerances based on perceptibility again exceed this (larger) variation, but if necessary measurement errors can be reduced by adding a deuterium lamp. Combination W-D2 sources are readily available.
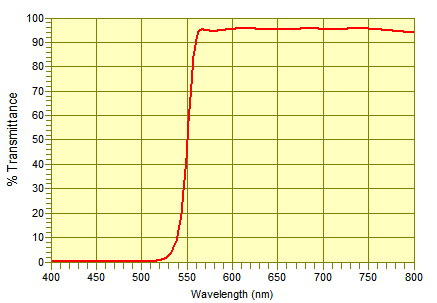
While not implying that diode-array spectroscopy is suitable for all filters, it appears highly suitable for typical color filters which do not include unusual performance criteria and do not contain excessively sharp narrow spectral features. Users might want to verify results with a dual-beam instrument even if they use diode-array for daily measurements. To put these variations in perspective, the following values were calculated (DESIGN Interactor) for a highpass filter with 50% edge at 535, 550, 552, 565 nm.
Comparing differences in the middle two filters (550, 552 nm), we gain confidence in assuming that, in this case, measurement errors are negligible.
In another example, a magenta filter with red edges at 615 and 617 nm, we see once again that imperceptible color differences exceed diode-array measurement errors.
It is also worth mentioning that color filters may include UV blocking requirements. While UV < 1% is in the realm of diode-array spectroscopy, UV < 0.01% is not. Note: Edmund Optics sells 45° color separating dichroic filters with ± 15 nm 'Coating Tolerances'. This seems excessive and suggests potential problems when matching filters. Warning: Suitability for QA pass/fail is not the same as suitability for n,k determination, as would be required for catalog data. For this task, double-beam instruments are recommended. For anyone wondering how the first figure (100% Test) was generated, the FilmStar MEASURE BASIC macro is given below. 'OOI Sample.bas' is included in the FilmStar installation when 'Ocean Optics Server' is selected. StellarNet spectrometers are also supported. Option Explicit DefInt I-N ' Note: 1. Open CIE dialog before running ' 2. Run after Dark and Reference scans Sub Main PlotClose: PlotActivate Dim k, b As Boolean Const kInt = 1 ' interval in minutes, change as required Do DoEvents If kInt = 1 Then ' one minute interval b = True Else ' no Mod function, so use this b = (Int(Minute(Time)/kInt) = Minute(Time)/kInt) End If If b And (Second(Time) <= 2) Then k = k + 1 PlotLegend(k) = CStr(Time) BasChain "C:\Winfilm\Basic32\OOI Sample.bas" Replot: PlotNext AppActivate "CIE Color" MainActivate End If Loop Until k = 10 End Sub |
Copyright © 2023 FTG Software Associates
Last updated on
January 31, 2023