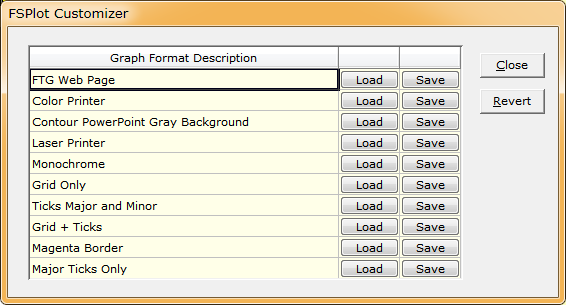
Click File..
Customizer <Ctrl+U> in the FSPlot Module to open the Customizer window.
Enter a description and click the Save button to retain
current Graph Details and window size. Up to 10 formats can be
stored. Click Load to regenerate the graph with the selected
format. Following a report of inconsistent behavior, the Customizer
was updated in DESIGN 2.61.4755 and MEASURE 2.51.2090 (Oct 2022).
The Customizer is shared by DESIGN and MEASURE. Transfer formats
to other users by copying PlotModule Format entries in
..\Winfilm\Config\Common.ini. To try the above settings: (1) Close
DESIGN or MEASURE; (2) To retain previous settings, rename [PlotModule]
to [PlotModuleBAK]; (3) Copy and paste the settings listed below;
(4) Resave Common.ini; (5) Restart DESIGN or MEASURE. The <Revert>
button restores original format settings.
[PlotModule]
FormatR=Future use
Format0=FTG Web Page\\PlotConfig 8986825, 2128, 0|PlotSize 10035,
7545, 83|PlotTitleFont = "Arial"|PlotTitleSize = 110|PlotLegendSize
= 100|PlotLegendSimple = False|PlotAxesFont = "Franklin Gothic
Medium"|PlotAxesLabelSize = 100|PlotAxesNumberSize =
100|PlotFontFixed = False|PlotFontFixedSize = 0|PlotAxesConfig =
0|PlotEdgeSpace 40, 0, 40, 0|PlotAxesSpace .15, .3, .3,
.5|PlotColors "255, 16711680, 57088, 16711935, 8421376, 32896, 0,
8421504, 128, 8388608, 32768, 8388736"|PlotBitmapMode =
True||PlotBitmap(1) = ""|PlotBitmap(2) = ""|PlotBitmapType =
2|PlotBitmapColors 13434828, 12648447, 12648447, 22873, 0,
4227200|PlotTableColors 16777215, 0, 0, 0
Format1=Color Printer\\PlotConfig 8462537, 2120, 0|PlotSize 10035,
7575, 91|PlotTitleFont = "Arial"|PlotTitleSize = 110|PlotLegendSize
= 100|PlotLegendSimple = False|PlotAxesFont = "Franklin Gothic
Medium"|PlotAxesLabelSize = 100|PlotAxesNumberSize =
100|PlotFontFixed = False|PlotFontFixedSize = 0|PlotAxesConfig =
0|PlotEdgeSpace 40, 0, 40, 0|PlotAxesSpace .15, .3, .3,
.5|PlotColors "255, 16711680, 57088, 16711935, 8421376, 32896, 0,
8421504, 128, 8388608, 32768, 8388736"|PlotBitmapMode =
False||PlotTableColors 16777215, 0, 0, 0
Format2=Contour PowerPoint Gray Background\\PlotConfig 8987849,
2128, 0|PlotSize 12045, 8370, 71|PlotTitleFont = "Arial"|PlotTitleSize
= 110|PlotLegendSize = 100|PlotLegendSimple = False|PlotAxesFont =
"Franklin Gothic Medium"|PlotAxesLabelSize = 100|PlotAxesNumberSize
= 100|PlotFontFixed = False|PlotFontFixedSize = 0|PlotAxesConfig =
0|PlotEdgeSpace 60, 0, 40, 0|PlotAxesSpace .15, .3, .3,
1.5|PlotColors "255, 16711680, 57088, 16711935, 8421376, 32896, 0,
8421504, 128, 8388608, 32768, 8388736"|PlotBitmapMode =
True||PlotBitmap(1) = ""|PlotBitmap(2) = ""|PlotBitmapType =
2|PlotBitmapColors 7303023, 12648447, 12648447, 22873, 16777215,
7303023|PlotTableColors 16777215, 0, 0, 0
Format3=Laser Printer\\PlotConfig 8462538, 2120, 0|PlotSize 10035,
7575, 91|PlotTitleFont = "Arial"|PlotTitleSize = 110|PlotLegendSize
= 100|PlotLegendSimple = False|PlotAxesFont = "Franklin Gothic
Medium"|PlotAxesLabelSize = 100|PlotAxesNumberSize =
100|PlotFontFixed = False|PlotFontFixedSize = 0|PlotAxesConfig =
0|PlotEdgeSpace 40, 0, 40, 0|PlotAxesSpace .15, .3, .3,
.5|PlotColors "255, 16711680, 57088, 16711935, 8421376, 32896, 0,
8421504, 128, 8388608, 32768, 8388736"|PlotBitmapMode =
False||PlotTableColors 16777215, 0, 0, 0
Format4=Monochrome\\PlotConfig 143204545, 222128, 0|PlotSize 18405,
9825, 50|PlotTitleFont = "Arial"|PlotTitleSize = 110|PlotLegendSize
= 100|PlotLegendSimple = False|PlotAxesFont = "Verdana"|PlotAxesLabelSize
= 100|PlotAxesNumberSize = 100|PlotFontFixed =
False|PlotFontFixedSize = 0|PlotAxesConfig = 0|PlotEdgeSpace 40, 0,
40, 0|PlotAxesSpace .15, .3, .3, 1.5|PlotColors "255, 16711680,
57088, 16711935, 8421376, 32896, 0, 8421504, 128, 8388608, 32768,
8388736"|PlotBitmapMode = True||PlotBitmap(1) = ""|PlotBitmap(2) =
""|PlotBitmapType = 2|PlotBitmapColors 13434828, 12648447, 12648447,
11513775, 986895, 7303023|PlotTableColors 16777215, 0, 0, 0
Format5=Grid Only\\PlotConfig 9020625, 2128, 0|PlotSize 16560,
10155, 50|PlotTitleFont = "Arial"|PlotTitleSize = 110|PlotLegendSize
= 100|PlotLegendSimple = False|PlotAxesFont = "Arial"|PlotAxesLabelSize
= 100|PlotAxesNumberSize = 100|PlotFontFixed =
False|PlotFontFixedSize = 1|PlotAxesConfig = 0|PlotEdgeSpace 50,
-25, 50, 25|PlotAxesSpace .15, .3, .3, 1.5|PlotColors "255,
16711680, 57088, 16711935, 8421376, 32896, 0, 8421504, 128, 8388608,
32768, 8388736"|PlotBitmapMode = True||PlotBitmap(1) =
""|PlotBitmap(2) = ""|PlotBitmapType = 2|PlotBitmapColors 13434828,
12648447, 12648447, 11513775, 0, 32896|PlotTableColors 16777215, 0,
0, 0
Format6=Ticks Major and Minor\\PlotConfig 9020497, 202128,
0|PlotSize 16560, 10155, 50|PlotTitleFont = "Arial"|PlotTitleSize =
110|PlotLegendSize = 100|PlotLegendSimple = False|PlotAxesFont = "Arial"|PlotAxesLabelSize
= 100|PlotAxesNumberSize = 100|PlotFontFixed =
False|PlotFontFixedSize = 1|PlotAxesConfig = 8|PlotEdgeSpace 50,
-25, 50, 25|PlotAxesSpace .15, .3, .3, 1.5|PlotColors "255,
16711680, 57088, 16711935, 8421376, 32896, 0, 8421504, 128, 8388608,
32768, 8388736"|PlotBitmapMode = True||PlotBitmap(1) =
""|PlotBitmap(2) = ""|PlotBitmapType = 2|PlotBitmapColors 13434828,
12648447, 12648447, 11513775, 0, 32896|PlotTableColors 16777215, 0,
0, 0
Format7=Grid + Ticks\\PlotConfig 9020625, 202128, 0|PlotSize 16560,
10155, 50|PlotTitleFont = "Arial"|PlotTitleSize = 110|PlotLegendSize
= 100|PlotLegendSimple = False|PlotAxesFont = "Arial"|PlotAxesLabelSize
= 100|PlotAxesNumberSize = 100|PlotFontFixed =
False|PlotFontFixedSize = 1|PlotAxesConfig = 8|PlotEdgeSpace 50,
-25, 50, 25|PlotAxesSpace .15, .3, .3, 1.5|PlotColors "255,
16711680, 57088, 16711935, 8421376, 32896, 0, 8421504, 128, 8388608,
32768, 8388736"|PlotBitmapMode = True||PlotBitmap(1) =
""|PlotBitmap(2) = ""|PlotBitmapType = 2|PlotBitmapColors 13434828,
12648447, 12648447, 11513775, 0, 32896|PlotTableColors 16777215, 0,
0, 0
Format8=Magenta Border\\PlotConfig 8986826, 2120, 0|PlotSize 10035,
7575, 91|PlotTitleFont = "Arial"|PlotTitleSize = 110|PlotLegendSize
= 100|PlotLegendSimple = False|PlotAxesFont = "Franklin Gothic
Medium"|PlotAxesLabelSize = 100|PlotAxesNumberSize =
100|PlotFontFixed = False|PlotFontFixedSize = 0|PlotAxesConfig =
0|PlotEdgeSpace 40, 0, 40, 0|PlotAxesSpace .15, .3, .3,
.5|PlotColors "255, 16711680, 57088, 16711935, 8421376, 32896, 0,
8421504, 128, 8388608, 32768, 8388736"|PlotBitmapMode =
True||PlotBitmap(1) = ""|PlotBitmap(2) = ""|PlotBitmapType =
2|PlotBitmapColors 16744703, 12648447, 12648447, 11513775, 0,
32896|PlotTableColors 16777215, 0, 0, 0
Format9=Major Ticks Only\\PlotConfig 9020497, 202128, 0|PlotSize
16560, 10155, 50|PlotTitleFont = "Arial"|PlotTitleSize =
110|PlotLegendSize = 100|PlotLegendSimple = False|PlotAxesFont = "Arial"|PlotAxesLabelSize
= 100|PlotAxesNumberSize = 100|PlotFontFixed =
False|PlotFontFixedSize = 1|PlotAxesConfig = 0|PlotEdgeSpace 50,
-25, 50, 25|PlotAxesSpace .15, .3, .3, 1.5|PlotColors "255,
16711680, 57088, 16711935, 8421376, 32896, 0, 8421504, 128, 8388608,
32768, 8388736"|PlotBitmapMode = True||PlotBitmap(1) =
""|PlotBitmap(2) = ""|PlotBitmapType = 2|PlotBitmapColors 13434828,
12648447, 12648447, 11513775, 0, 32896|PlotTableColors 16777215, 0,
0, 0
Users familiar with
FilmStar BASIC may recognize that
each Format is a collection of the BASIC commands generated
in the plot module when clicking File..Create BASIC Code.
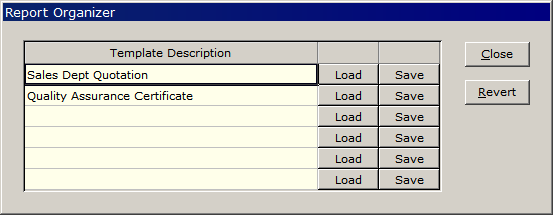
A similar
capability is available in the Report Generator. Click
File.. Organizer <Ctrl+Z> to access the Report Organizer.
Templates are saved separately for
DESIGN (Design1.ini) and MEASURE (Measure.ini).
Back
to Technical Issues