Technical Issues - n&k for Oxides Step by StepUsers frequently need to deduce n,k for oxides such as TiO2, Ta2O5 and HfO2. It is important to understand the process before implementing automatic methods. This page is divided into four sections:
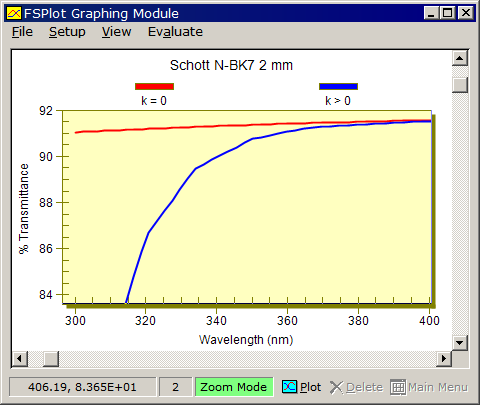
1. Substrate Properties...When analyzing an oxide, one typically deposits a thick layer resulting in multiple fringes in the range 400-800 nm. The first task is to characterize and/or verify substrate optical properties using a calibrated double-beam spectrophotometer and FilmStar MEASURE. Proper technique is essential. Measure substrate %T and compare with published n,k values (if available). While Schott and other glass dispersive functions (Sellmeier $SELL) are included in FilmStar, these assume k=0. This assumption is usually valid in the VIS/NIR range, but consult data sheets such as supplied by Schott to be sure. An Excel program helps users transfer Schott data to FilmStar. Fused silica substrates are recommended for UV films.
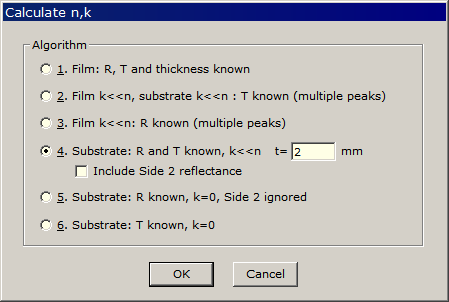
FilmStar INDEX includes several substrate analysis methods. Algorithm 4 is helpful when there is no information about the glass substrate (for example, anonymous microscope slides). This screen appears after importing a spectrum with Solve...Open/Paste Spectrum.
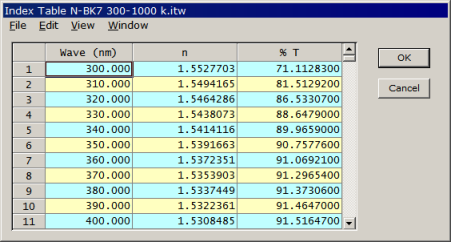
If absorption data are not available, but refractive index n is known, k can be obtained by pasting internal transmittance t or measured %T values in INDEX's Index Table dialog. This capability is enabled by selecting 'Table type' Filter glass in Setup...Parameters. Accuracy is paramount as the system does not permit %T values corresponding to t (internal transmittance) > 1.0. To examine k values change 'Table type' to Index. Note that k can be viewed in scientific notation via View...Scientific Notation.
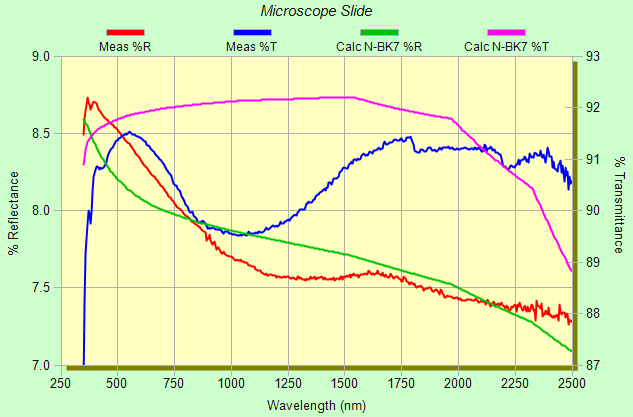
Consider the graph below. The FilmStar user who submitted the data intends to repeat measurements with optical glass like BK7. The user also intends to take advantage of MEASURE's smoothing algorithms, including the ability to smooth reference and baseline scans.
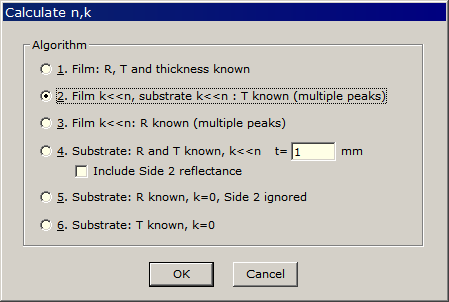
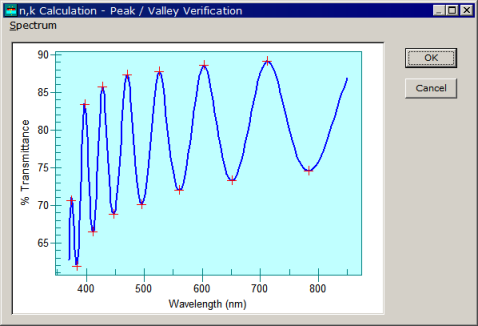
%R measurements were performed with a URA accessory in VN mode. This is a complex device whose accuracy requires user-verification. In our case V mode measurements are called for, but that entails a known standard. In practice users often depend on Schott n tables (based on very accurate refractometry) supplemented with k values deduced from %T measurements. Ultimately we will be more confident in our methods when substrate measurement and theory overlap. While n,k calculated with Algorithm 4 from the above data is probably good enough for peak analysis, the requirements of point-by-point n,k calculations will be more stringent. 2. Peak Analysis...Deposit a thick film, say 600-900 nm. Thinner films may produce too few peaks. Materials are assumed to have negligible absorption and be nondispersive at higher wavelengths. If that is not the case, it may still be possible to deduce n,k as in Section 3. Measure %T with FilmStar MEASURE and save or copy the spectrum. Returning to INDEX, import the spectrum with Solve...Open/Paste Spectrum. When the following dialog appears, select Algorithm 2.
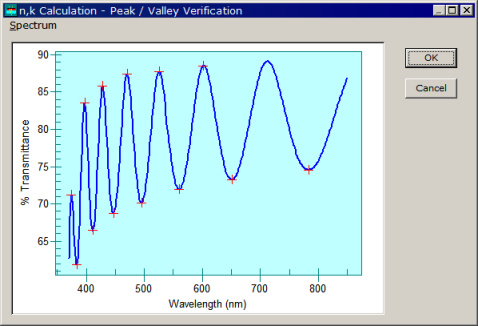
Click OK to arrive at the following screen. There is a problem! The peak at ~720 nm is missing.
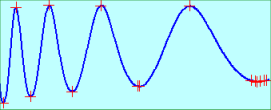
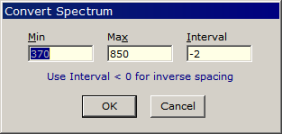
Multiple peaks are also possible as shown below left. These problems are typically caused by spectra containing too many points on the high wavelength side. Fixes available in the dialog's drop-down Spectrum menu include Convert Spectrum. Revert recovers the original spectrum.
Following Convert Spectrum, all peaks should be identified and there should be no multiple peaks. If multiple peaks are still observed try choosing a wider peak width such as “9” and/or broaden the Convert Spectrum interval to perhaps “-5.”Sujeet's TiO2 is cold deposited (ophthalmic application) and has lower n values and higher k values than usual.
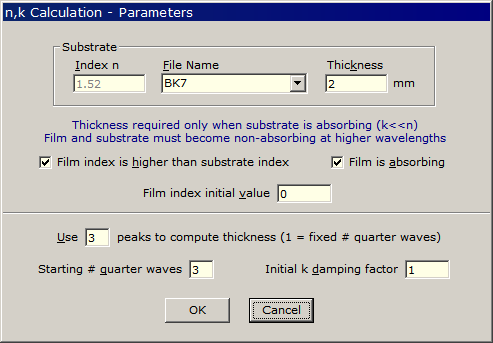
Clicking OK brings up the Parameters screen.
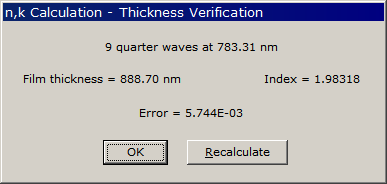
Clicking OK computes thickness and brings up the Thickness Verification screen. Thickness should be close to the expected value, if not click Recalculate to try with different parameters.
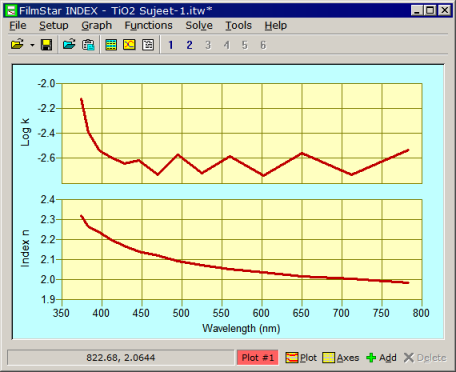
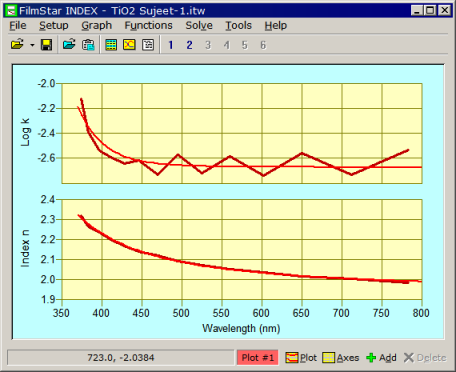
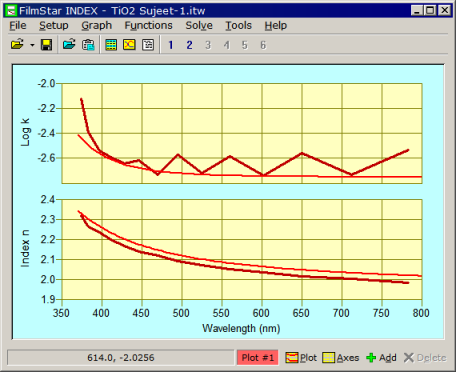
Finally, results are displayed graphically. You may need to use Graph...Auto Scale to display values. Typically select a Log k plot for oxides. Do results look reasonable? In this case they do.
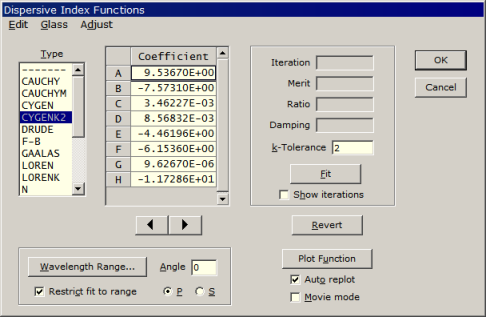
Our next task is to find a suitable dispersive function which fits the n,k data. Click Functions...Built-in to review built-in functions. Click Functions...Fit Index to bring up the dialog show below.
We must now enter a suitable function type with coefficient starting values. This is accomplished through a combination of previous experience (tables below) and trial-and-error. With Auto replot checked, highlight a coefficient and use the up/down arrow keys to manually adjust. Unchecking Auto replot when setting up a new function prevents a possible "Function not defined" message. LORENK is usually suitable for oxides but did not work well for Sujeet's absorbing films. We settled on CYGENK2, a generalized Cauchy with absorption. Click Fit <Alt+F> to refine coefficients. The Ratio value indicates the improvement while the Matrix Cannot Be Inverted error indicates a poor choice for function and/or starting coefficients. In our TiO2 example results look reasonable; the light red line shows the dispersive function.
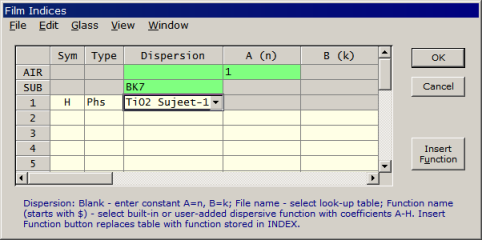
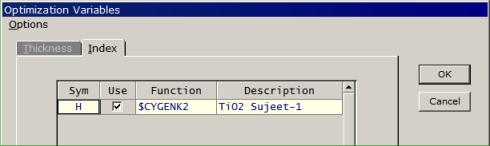
We now have a starting point for further refinement in FilmStar DESIGN. Be sure to save the INDEX file (*.itw) for subsequent use! 3. Refine Dispersion Function...We now turn to DESIGN to verify and refine INDEX's results. We make use of the entire spectrum and are no longer subject to the approximations of the peak-valley fit. This method is an implementation of Dobrowolski, J. A., Ho, F. C. and Waldorf, A., “Determination of optical constants of thin film coating materials based on inverse synthesis”, Applied Optics 22, 3191-3200 (1983). We click Setup...Film Indices in DESIGN and select TiO2 Sujeet-1 under Dispersion. This indicates that the n,k table in 'Tio2 Sujeet-1.itw' will be utilized in our thin film calculation.
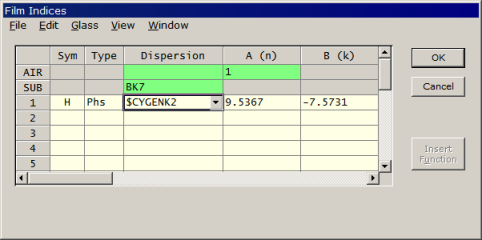
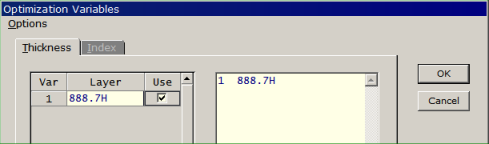
Click button Insert Function (below Cancel) to replace the n,k table by its associated function (CYGENK2 in this case) whose coefficients can be optimized with respect to the target spectrum.
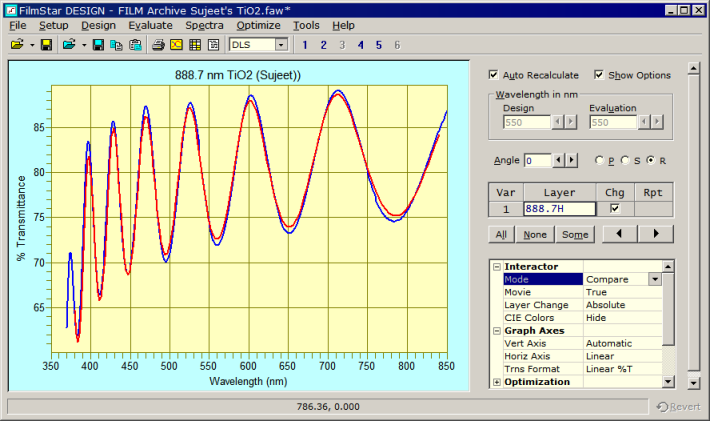
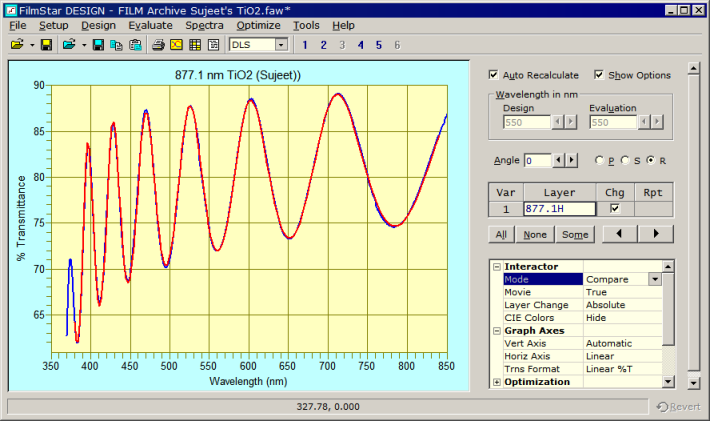
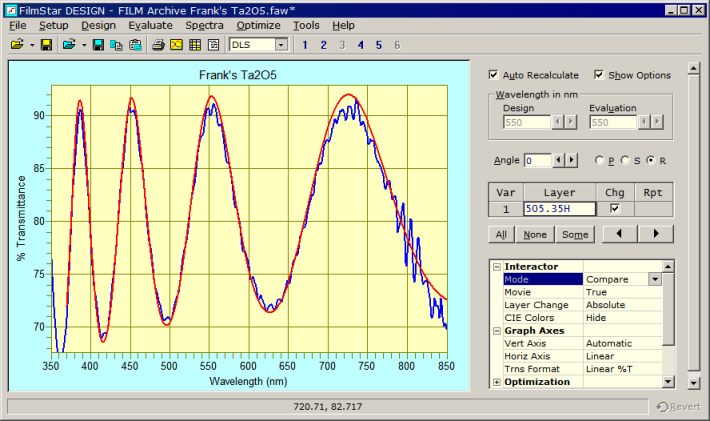
Close the Film Indices dialog and click Evaluate...Interactor <Ctrl+Q> where the target Spectrum and the current fit can be compared. Click Spectra...Open or Spectra...Paste to compare the measured spectrum in blue with the calculated spectrum in red. This optional step verifies that we are on the right path!
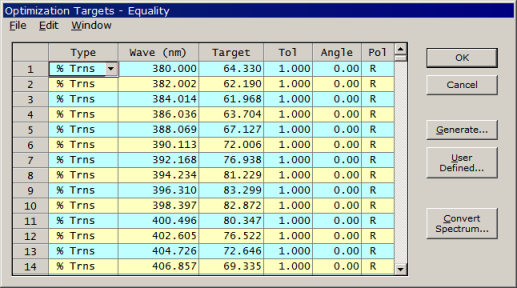
Click Optimize...Targets to open the Targets dialog. File...Clear Grid <Shift+Del> clears any previous targets. The Convert Spectrum <Alt+C> button converts the current spectrum to targets. Note that the target spectrum is not evenly spaced in nm. The original spectrum was 370 to 850 x 1 nm. Our evaluation range is 380 to 840 x -2 nm (contained within the original spectrum). The negative interval indicates 'inverse spacing' whereby an interval of 2 at 380 nm becomes 4.4 at 840 nm. Long and short wavelength zones thus contribute equally to the merit function. Open the target spectrum and click Spectra...Convert Table <Ctrl+F8> before accessing the targets dialog. Click Optimize...Targets to access the Targets dialog and then (if necessary) File...Clear Grid <Shift+Del> to delete any current targets. Finally, click the Convert Spectrum button to create new targets.
Updated coefficients can be transferred from DESIGN to INDEX. While not absolutely necessary, this step lets users visualize results and reject unreasonable solutions. In DESIGN click Setup...Film Indices followed by Edit...Copy Function. We now return to INDEX to verify values obtained in DESIGN. In INDEX click Functions...Fit Index followed by Edit...Paste Function. You can conveniently accomplish the same with Functions...Paste & Plot <Ctrl+S>. Click Functions...Create Table to replace peak-valley values.
As previously mentioned, simpler functions such as LORENK appear to be suitable for many oxides. Some examples and a table of coefficients follow.
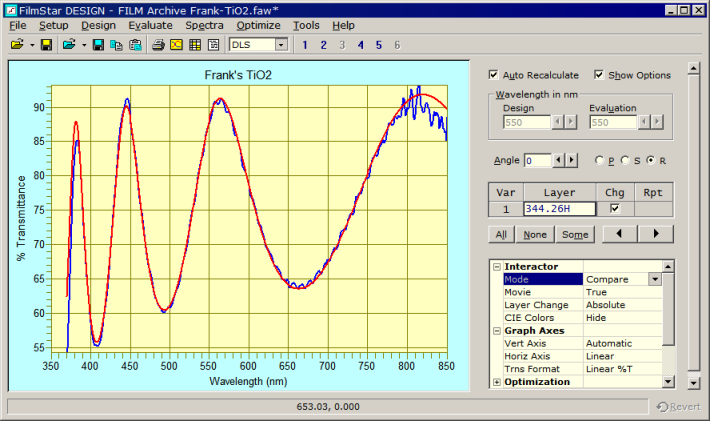
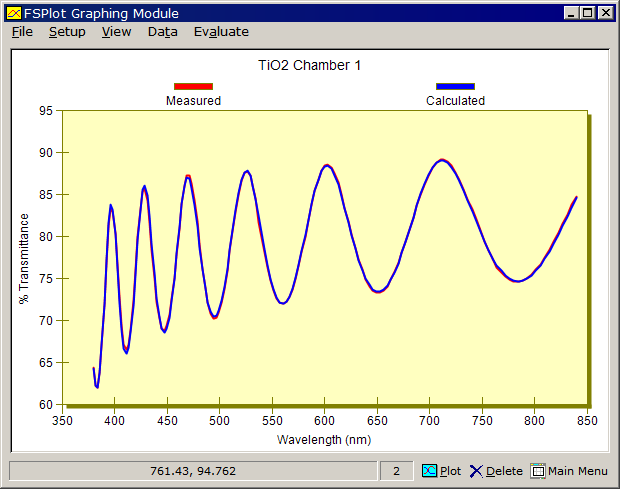
As shown below, reasonably good fits are even possible with defective data. Here it is impossible to use the peak-valley method, but visual inspection indicates that direct fitting will work. Unlike the peak-valley method direct curve fitting averages over spectrometer noise. This suggests that stable diode-array spectrometers may be suitable for deducing n,k.
Results are summarized in the following table. Functions may be copied to the clipboard (starting with $) and pasted directly into INDEX's Dispersive Index Functions dialog via Edit...Paste Function.
*CAUTION:
The suspicious excellence of this fit suggests 4. Automate...Optical coaters typically utilize the same materials over and over and need to know whether n,k values have shifted, thereby necessitating corrections to thin film designs. Assuming that things have not gone completely amiss, the same functions can be used repeatedly with only minor variations. Since spectral noise is averaged, stable and calibrated diode-array spectrometers might be suitable for monitoring n,k shifts. While the material above might seem somewhat complicated, once a procedure is established for a material-substrate system and it is determined that a particular function (say LORENK) always applies, FilmStar BASIC automates routine index fitting. This is accomplished with the following BASIC functions:
If the initial value of the film thickness is far off, spurious
solutions are inevitable. Requirements can be tested in
Gedankenspektrum calculations.
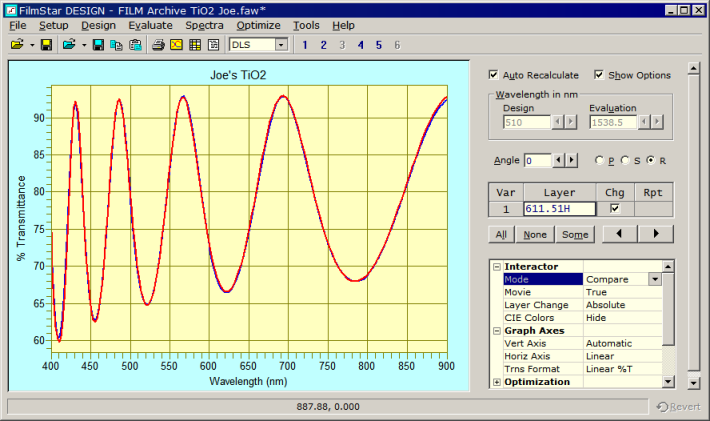
For example, generate targets corresponding to a 300 nm film (say Joe's
TiO2) and assume an initial guess of 350 nm. Does refinement correctly
restore the value to 300 nm? What if coefficient A is modified? Try 400 nm
and see what happens. What is optimum film thickness? If too thin there may
not be enough information; if too thick fringes overlap. Thinner films than
those required for peak-valley analysis are recommended.
Need help with FilmStar BASIC? Click here for a BASIC tutorial. |
Copyright © 2023 FTG Software Associates
Last updated on
January 31, 2023