|
Technical Issues - FilmStar News 2012 Other editions:
2006, 2007, 2008,
2009, 2010,
2011,
2013 January 3 Windows 7 Library A new feature in Windows 7 is the Library which organizes data stored in various file locations including networks. Users may find it useful to add some or all FilmStar data files.
To set this up, right
click on Libraries in Windows Explorer and select New..
Library which you can name FilmStar, Winfilm or whatever you
prefer. Navigate to the actual FilmStar directory (usually C:\Winfilm
but possibly a network location), right click on a subdirectory name
and click
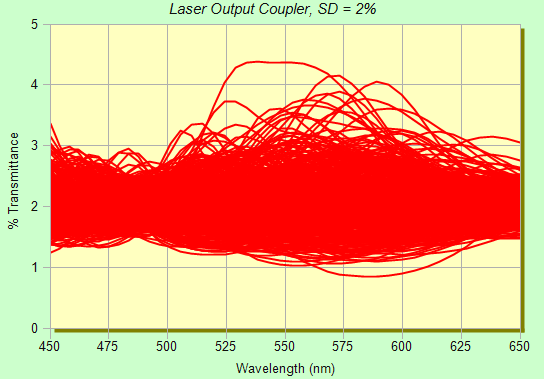
Include in library.. FilmStar. January 9 Tolerance Envelopes Tolerancing curves help us understand the effects of layer errors. Curves can be generated in the main DESIGN screen as well as in the FSPlot Module (with speed and capacity limitations). This is illustrated in the following with FILM Archive LASER-O.faw.
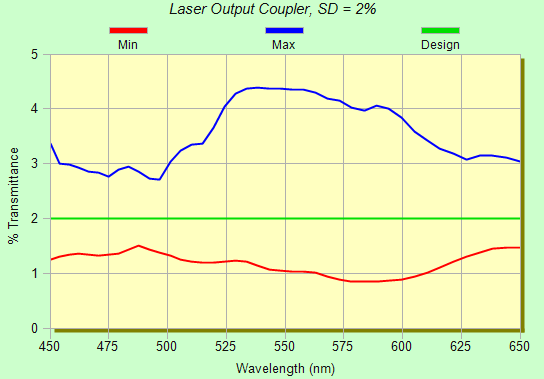
When examining the above imagine two envelopes, one with all minimum values and the other all maximum values. Using FilmStar BASIC, the envelopes are quickly calculated by program TolerEnvl.bas. If this file is not found in ..\Winfilm\Basic32, run the FilmStar installer. This case corresponds to the previous graph.
Enter error values in Evaluate..
Tolerancing.. Values <Ctrl+N>. The number of iterations (nIter)
and random number seed (CalcRandSeed) are specified in TolerEnvl.bas.
Since the area between envelopes increases with additional iterations,
it is important to use a fixed number of iterations when comparing
designs. Use a large enough value (say 10000) so that additional
iterations are insignificant. Ultimately the most powerful tolerancing
facility is the FilmStar Workbook,
but in many cases the simple and fast envelope technique will be quite
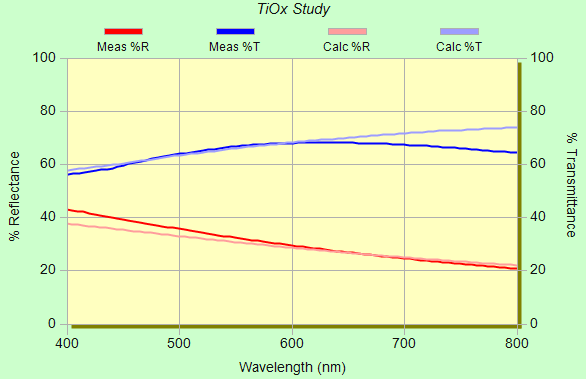
sufficient. January 19 Comparing %R and %T Spectra The Interactor can graphically compare measured and calculated %R or %T spectra. In most cases this is adequate. But sometimes it is useful to compare %R and %T spectra. This can be accomplished by having the FSPlot Module open at the same time as the Interactor (DESIGN 2.61.2245).
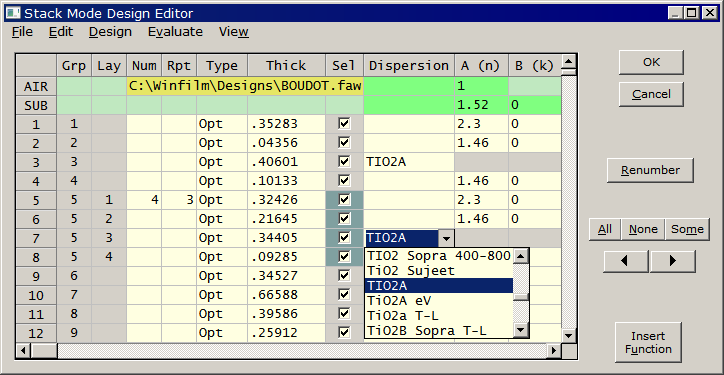
March 12 Stack Mode The Stack Mode Design Editor (DESIGN 2.61.3008) combines features from Film Indices and Layers Mode dialogs. Each layer has its own dispersion expressed as constants, lookup tables, and index functions. An index function can include user-defined formulas as well as material mixtures based on various models including Bruggeman and Maxwell-Garnet. While illustrated here for the familiar Boudot design, Stack Mode is especially useful in the case of many materials, as in rugate designs.
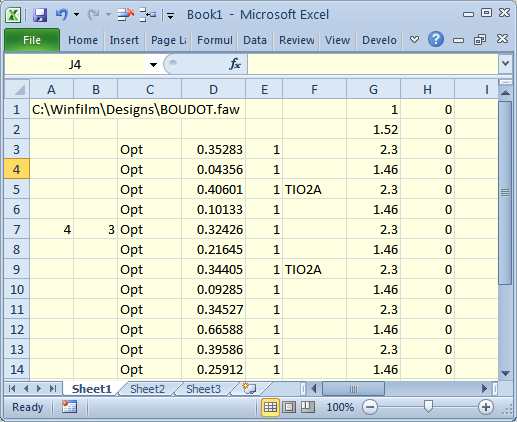
The Stack Mode editor works with the Interactor, supports optimization, and allows massive layers. Note how (.32426H .21645L .34405H .09825L)3 is converted to Num (number of layers in a group) and Rpt (repeat factor) entries. Grp and Lay columns are computed and therefore not user-modifiable. A Notes column (not shown here) can be used for descriptions or commands. In the current version command {Link...} replaces Optimize...Link Variables. Designs can be transferred to/from Excel by copy/paste or import/export of TAB delimited .txt files. A number of new
BASIC subroutines and functions have been added: StackCopy,
StackDelete, StackIndex, StackIndexSet, StackNote, StackNoteSet,
StackSelect, StackSelected, StackRows. In addition IndexCoeff,
SetIndexCoeff, LayerThk, SetLayerThk also support Stack Mode. These are
all described in the help system and provide great flexibility for
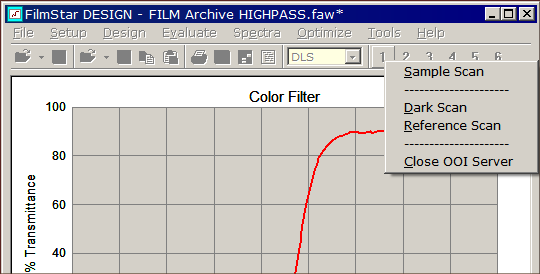
advanced users. April 18 Running Spectrometers from DESIGN It appears not well known that DESIGN can directly run rapid-scan spectrometers including popular devices from Ocean Optics and StellarNet. This is most convenient for reverse-engineering. MEASURE also controls these instruments, but why not eliminate extra steps?
The following macro assigns four OOI macros (included in the FilmStar installer) to a single button. This is not, however, the only way to organize matters. One alternative is to bring up a dialog box which triggers the various scan procedures.
Finally, we assign MenuOOI.bas to Macro Command button 1. 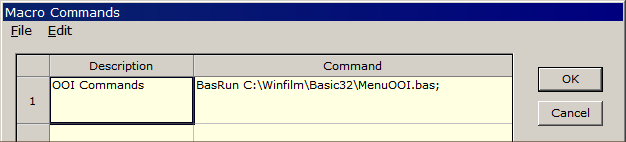 Since it's easy
to forget to close the OOI Server before closing FilmStar (leaving
Ocean2.exe as an active process), DESIGN 2.61.3020 adds a shut-down
macro in the Macro Commands dialog. This new capability can also be
found in MEASURE 2.51.1328.
We have an Ocean Optics unit and can elucidate the above via ZOOM. Designs with up to ~30K dispersive layers have been tested. 64-bit Windows 7 allows more layers than 32-bit Windows XP. Users who wish to get up and running with Stack Mode are invited to contact FTG for a ZOOM overview. April 23 Saving Reports as PDF The Report Generator print
engine in DESIGN 2.61.3021, MEASURE 2.51.1329 and MONITOR 2.52.0145 has
been updated. Users report that this fixes Windows 7 printing problems.
In the case of errors which cannot be resolved, we suggest saving
documents as PDF and printing from Adobe Reader. This is also useful
when FilmStar computers are not connected to printers or networks.
No idea how to
enter the above and assign to a macro button? Contact FTG for a
ZOOM meeting.
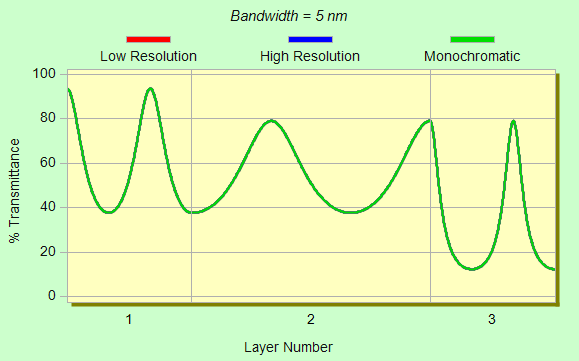
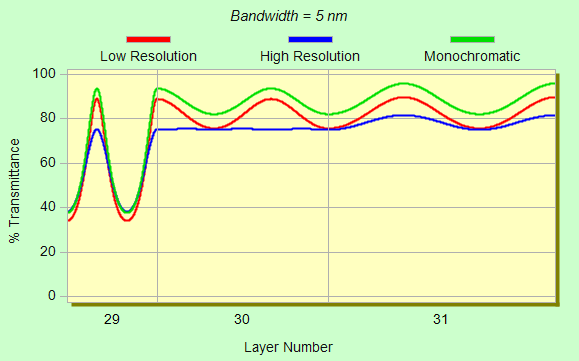
June 21 Bandwidth in Monitor Calculations New DESIGN
macros automate FSPlot's Formulator and calculate the effects of
non-zero monochromator bandwidth on spectra plotted as a function of
thickness (monitor plots). A Gaussian energy distribution with either 5
(low resolution) or 13 points (high) is utilized. Bandwidth (halfwidth)
is defined at 50%. The macros are now included in the FilmStar
installer.
The new macros have been added
to the FilmStar installer (DESIGN 2.61.3045). In addition,
bandwidth compensation has been implemented in MONITOR 2.52.0500.
The DESIGN macros provide means to verify MONITOR calculations. September 10 DDE Revisited DDE (Dynamic
Data Exchange) is a method for exchanging data and commands.
Although superceded by
COM,
DDE continues to be supported. In this section we show how to transfer spectra
from DESIGN or MEASURE to Excel, specifically
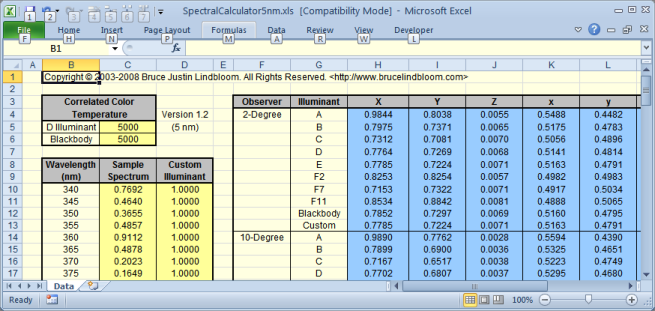
Lindbloom's Spectral Calculator.
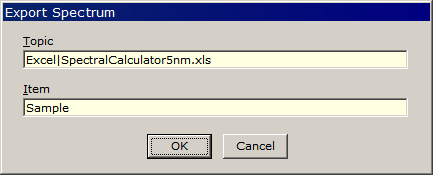
The Spectral Calculator requires R or T in column C. Clipboard copy or DDE export normally provides three {DESIGN: W, R, T} or two columns {MEASURE: W, R or T} columns. A new option in Spectra.. Format Options (DESIGN 2.61.3051, MEASURE 2.51.1346) specifies that only one column be copied or exported.
Data transfer has been tested in Excel 2000 and Excel 2010 (shown here). Unlike our COM-based solution using FilmStar BASIC, the Spectral Calculator must remain visible.
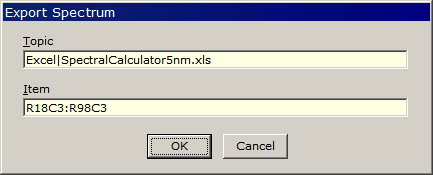
CIE color typically utilizes 380-780 x5nm. If 340-830 is inconvenient insert zeros in column C from 340-375, 785-830 and replace Item = Sample with Item = R18C3:R98C3. ($C$18:$C$98 doesn't work.)
Click Spectra.. DDE.. Export to transfer data or Spectra.. DDE.. Auto Export to automatically transfer data each time a spectrum is calculated in DESIGN or a Sample scan is performed in MEASURE. Note that this works in the DESIGN Interactor. DDE examples utilizing FilmStar BASIC can be found here. October 15 Spectra Files as Data Server Users with spectrophotometers not directly supported by MEASURE (e.g. Hitachi, Shimadzu, Jasco) can still take advantage of MEASURE capabilities by treating data files as 'servers'. In this way, MEASURE users can utilize the same well-proven and familiar Baseline-Reference-Sample-Standard formalism. This is especially important when accurate reflectance measurements are required. Recently a FilmStar user
requested the abiilty to
acquire spectra from Jasco spectrometers. Since Jasco does not publish
an
API for controlling its instruments, we need to import data files.
Examining several formats we determined
that J-CAMP (*.dx) was the simplest to implement, but %T was off
by a factor of 100. This typical J-CAMP inconsistency is addressed in DESIGN 2.61.3102, INDEX 2.51.0325 and MEASURE 2.51.1353 by adding a
multiplier automatically triggered by ##ORIGIN= JASCO.
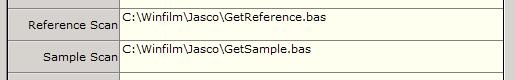
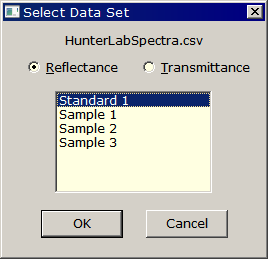
Sub Main  ' GetReference.bas
    DataType = 1 ' so we can open J-CAMP dx file
    f$ = GetFilePath(,"dx", "c:\Winfilm\Jasco", "Open Reference Spectrum")
    If Trim$(f$) <> "" Then
        FileOpen f$
        DataCopy
        DataType = 3 ' switch to Reference mode
        DataPaste
    End If
End Sub

Sub Main  ' GetSample.bas
    DataType = 1
    f$ = GetFilePath(,"dx", "c:\Winfilm\Jasco", "Open Sample Spectrum")
    If Trim$(f$) <> "" Then FileOpen f$
End Sub
Further simplification arises from repeatedly using the same file names. Nothing could be easier. Save the Jasco %T J-CAMP file and then click MEASURE's Scan button. Sub Main ' GetReference.bas DataType = 1 ' so we can open J-CAMP dx file FileOpen "c:\Winfilm\Jasco\Reference.dx" DataCopy DataType = 3 ' switch to Reference mode DataPaste End Sub Sub Main ' GetSample.bas DataType = 1 FileOpen "c:\Winfilm\Jasco\Sample.dx" End Sub Tired of using chemists' software with your spectrometer but have no idea how to use FilmStar BASIC? Contact FTG Software for an online explanation via ZOOM. October 18 HunterLab Spectra Import
October 26 INDEX R/T Spectra Merge
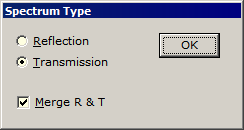
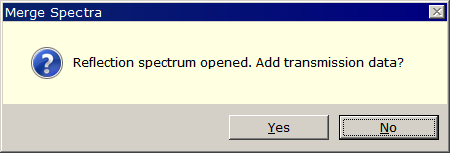
Although MEASURE can save reflectance and transmittance in a single 3-column .csv file (check Combine reflectance... in Spectra Format Options), this is mostly impractical. INDEX 2.51.0327 adds the ability to merge R & T spectra in .dx, .spc and .xls formats. Unlike .csv, these formats include spectrum type and the Spectrum Type dialog is not needed. Once again the spectra must have matching wavelength ranges.
Note that FilmStar .xls files are in a simplified format. They can be opened in FilmStar or Excel, but .xls files re-saved in Excel will not open in FilmStar. November 14 ARTA Support for OMT Solutions
OMT Solution's
Absolute Reflectance/Transmittance Analyzer (ARTA) PE/Cary
spectrophotometer accessory measures directional reflectance and
transmittance. There are a large number of scans and a multitude of
spectra. Automation is critical! No one wants to pay a
technician to stand in front of an instrument for hours on end.
Finding that the 'free' software supplied with the spectrophotometer did
not have automation capabilities, OMT president
Peter van
Nijnatten asked us to provide a FilmStar solution.
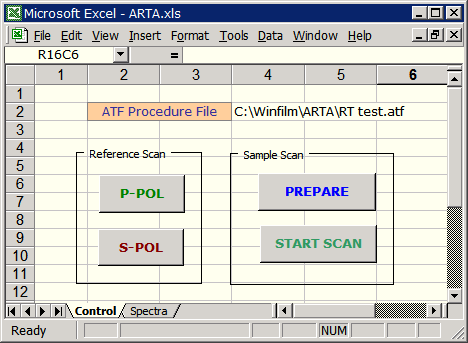
Our solution is an Excel workbook running FilmStar MEASURE. A stepper motor control had already been developed with a list of positions given in ATF procedure files (e.g. RT test.atf). Excel parses the file and fills in Pol, Sample, Detector rows as shown below. We also created a simulator using FilmStar DESIGN to help users develop analysis methods. In this case, it's an optimized BBAR coating.
The advantage of having
spectra in Excel rather than in separate data files or in the UV Winlab
database cannot be overemphasized. Everyone has Excel and if
Excel is not your favorite analysis tool, data can be directly imported
by programs such as
MATLAB.
A recent LinkedIn
discussion reminds us that OMT Solutions is a leader in optical
measurement technology. FilmStar MEASURE will support other accessories
as well, including the
Directional IV Absolute Reflectance Accessory.
Click here to learn more about measurements on highly reflective
coatings. Along these lines, in 2011 MEASURE added T^2 capability for
variable
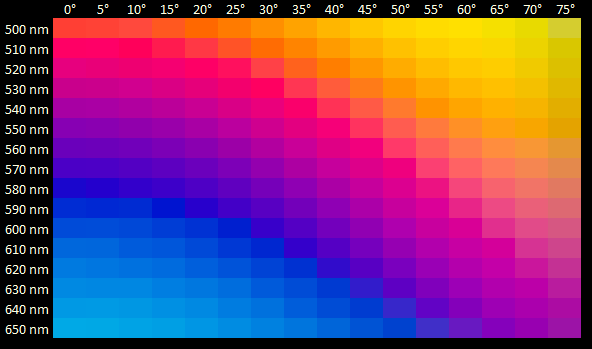
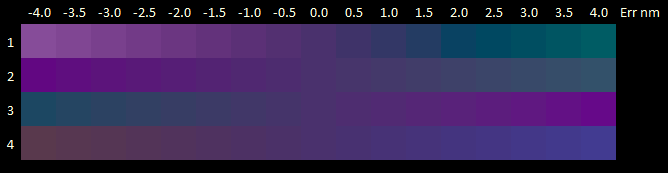
angle transmission accessories. December 24 Excel Color Grids
An advanced user in Texas needed to understand color variations
caused by thickness variations in two dielectric layers. We suggested
that a visual representation would be helpful and proposed adding a new
BASIC function to return RGB colors. The function Sub
GetCieColor could then be used to set colors in Excel grids as shown below.
This capability is now available in DESIGN 2.61.3130. Sub GetCieColor
optionally returns CIE coordinates (D65 illuminant) and includes
RGB Boost for
visualizing color shifts in AR designs. Two turnkey examples can be
downloaded:
1. Excel workbook Colors.xlsm and FILM Archive Highpass-O.faw (copy to ..Winfilm\Designs). Hit <Alt+F8> to run Excel VBA macro ShowColors. This image indicates how one might compensate for angular variation with non-uniform coating distribution. (When run for the first time it may be necessary to run the macro twice as DESIGN may not have fully opened in the background.) Since design wavelength is varied, the design must be specified in optical thickness. (Instructive exercise: modify the workbook for designs in physical thickness.)
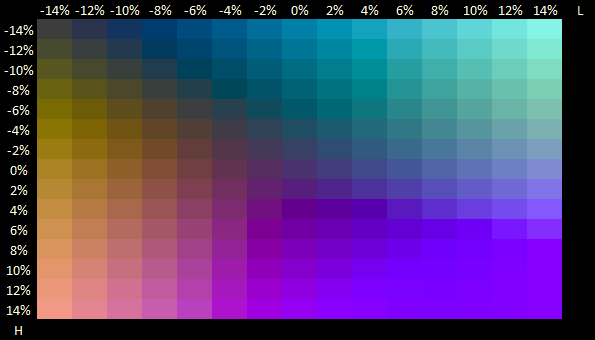
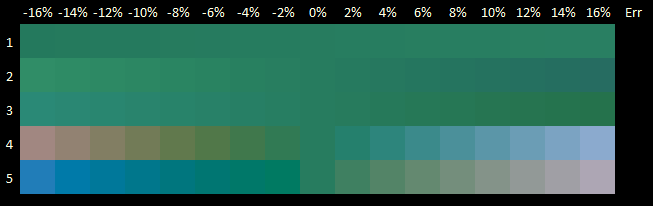
2.
Tooling.xlsm and
FILM Archive
BBAR-O.faw (copy to ..Winfilm\Designs)
help us visualize shifts resulting from tooling variations in AR
coatings. Hit <Alt+F8> to run Excel VBA macro VaryTooling.
The macro sets RGB Boost = 25 to exaggerate color shifts. This image
should be of interest to ophthalmic coaters.
|
||||||||||
Copyright © 2023 FTG Software Associates
Last updated on
October 11, 2023